The relationship in digital advertising between awareness and direct response campaigns often seems inconclusive, particularly if your budget is small, you don’t have a lot of historical data, and you’re unable to run a media mix model.
But what about campaigns that sit between awareness-building and driving conversions?
In this post, we’ll share data on how mid-funnel campaigns for two clients helped drive lower-funnel performance and how we measured it.
The Difference In Upper Funnel And Mid-Funnel Audiences
For clarity, we define upper funnel as campaigns that reach mass audiences that may or may not be in the market for your product or service, and these audiences likely have little to no awareness of your brand and no immediate buying intent.
Middle-funnel campaigns target a narrower audience that could be in-market for your product or service, but may be unfamiliar with your brand. These audiences have some degree of buying intent, but not as much as a lower-funnel audience.
Google Demand Gen Campaign Performance
In 2023, Google introduced Demand Gen campaigns, which include the same inventory as Performance Max (PMax) campaigns minus Search, Shopping, and Maps placements. What remains is YouTube, Gmail, and Discover. The goal of Demand Gen campaigns is to reach people in the exploratory phase of their buyer’s journey.
For an e-commerce client, we launched a Demand Gen campaign in Q3 2024 that included a variety of YouTube videos, including product videos and testimonials, as well as headlines and descriptions pertaining to a specific product line.
The audience we targeted included a lookalike of past purchasers and a custom audience segment consisting of people who searched for related products. We also excluded all past purchasers.
We optimized for purchases but set a higher CPA target than our PMax campaigns given the funnel stage. To measure the results, we looked at direct purchases attributed to the campaign, as well as any lift in branded search performance.
The purchases attributed to the Demand Gen campaign were marginal, but this is what we noticed on branded search in the 45 days after the Demand Gen campaign launched compared to the prior period:
- Click thru rate: +10.1%
- Conversion rate: +53.7%
Thanks to the improvement in those metrics, Avg. CAC on the branded search campaign improved 5% period-over-period even with a rise in Avg. CPC.
Apple Search Tab and Product Page Campaign Performance
For mobile advertisers with iOS apps, Apple Search is likely part of your media mix. Other placement options in Apple Search include Search Tab, Product Pages, and the Today tab.
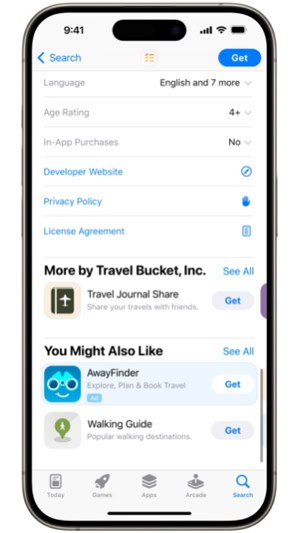
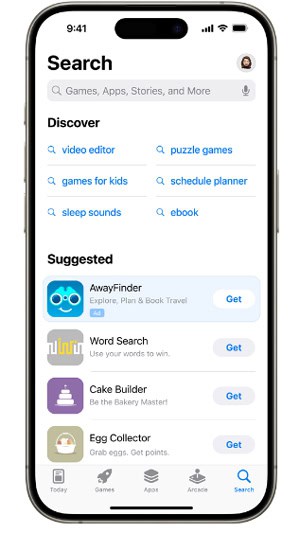
In a recent test, we launched campaigns on Search Tab and Product Pages alongside Apple Search to see if we noticed any lift. While Apple Search ads allow advertisers to bid on specific keywords, Search Tab enables advertisers to reach users before they search, so the targeting is based less on intent and more on discovery. For Product Page ads, advertisers can reach users who scroll to the bottom of related product pages and view the “You Might Also Like” list of apps.
Besides tracking cost per install data for each respective campaign, we followed Apple Search performance in case any fluctuations (good or bad) coincided with the launch of the mid-funnel campaigns.
Here’s what we noticed on Apple Search in the 45 days after the Search Tab and Product Pages campaigns launched versus the prior period.
- Non-Brand Search (functional keywords)
- Tap-thru rate: +9%
- Conversion rate: +4%
- Cost per install: -7%
In addition, impressions and conversion rate on the branded search campaign both increased 2% period-over-period, contributing to a 12% overall improvement in cost per install.
Need help with your paid acquisition strategy? Reach out to us at [email protected] for a free consultation.

