There are multiple methods and tests to help you better understand the performance of your ad spend and other online marketing efforts.
Below are a few of these approaches. We’ll continue adding new tests to this post, so bookmark this page and keep checking back.
Quick aside: It’s easy to overthink testing, especially when you are a small company with limited data. In most cases, your time is better spent improving your underlying product versus poring over limited data that is not statistically significant.
Organic Facebook Split Tests
If you run the Facebook account for a large brand with >5k+ likes (the more, the better), there’s a way to test variants of organic posts before you publish them to your entire audience.*
- Follow these instructions to confirm that you can restrict your Facebook posts by location.
- Visit Facebook Business Manager and click on “Audience Insights” under the “Plan” section.
- Select “People connected to your Page” and then select your Page. Click on the Location tab to identify at least 2 cities with a comparable number of “likes.” The number of cities that you identify must coincide with the number of variants you want to test.
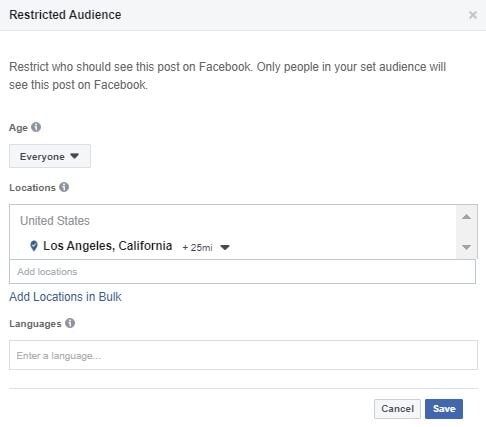
- Choose which post variants to test in each city, and then publish the posts at identical times, making sure that each post is geo-targeted to the designated location (pictured below).
- Wait 4-6 hrs for the posts to reach users. Whichever post has the best engagement rate or click-thru rate (depending on your goal), publish that variant to your entire audience without any geo-restrictions.
This approach assumes that audiences in different cities behave similarly, and this works well with larger pages that generate data quickly. Be sure that the content you test is not time-sensitive, because the test will delay the delivery of the content to your whole audience.
While this isn’t an air-tight test that data scientists will hold their hats on, it’s a quick way to figure out the best post when you’re unsure.
*By entire audience, we mean that the post will not be gated. No organic Facebook posts ever reach a brand’s entire audience of followers.
Facebook Conversion Lift Test
In Facebook Ads Manager, click on Test & Learn to see the types of self-serve tests that you can run.
- A/B Test: Test different versions of your ads to see which performs best.
- Holdout Test: Use a holdout group to measure the total conversions caused by your ads.
- Brand Survey: Poll your audience to measure the impact of your Facebook ads on your brand.
If you want a sense of the conversion lift that your Facebook and Instagram ads are generating, choose the holdout test. You can run the holdout test at the account level or campaign level. (To see how you can use this test as part of a holistic incrementality model, read this)
An A/B test is more granular if you’re curious about how an audience responds to different ad creative. While Facebook automatically over-delivers the best-performing ad in an ad set, it’s not a true split test since an audience could be exposed to multiple ads.
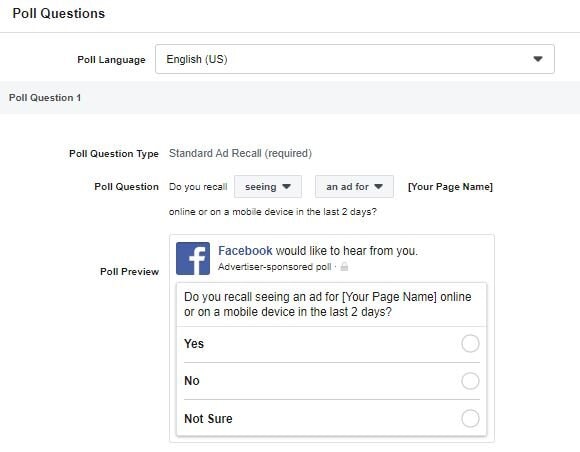
For a brand survey (pictured right), in order to run this, you must have spent at least $10,000 USD on Facebook in the past 90 days. The questions you ask can help you understand the lift in aided (but not un-aided) awareness, affinity, and purchase intent among the users exposed to your ads. Just keep in mind, what people say and do may be different things.
Geographic Splitting
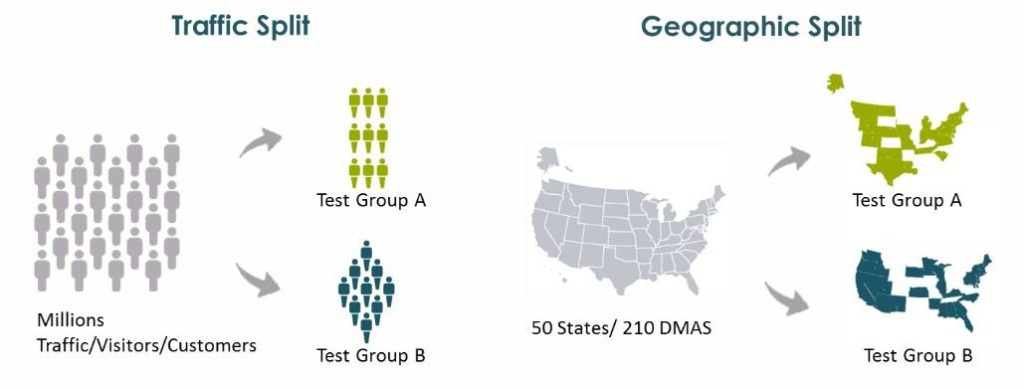
This is a more advanced testing methodology utilized by brands such as Wayfair to measure the incremental performance of offline ad spend (i.e. TV commercials, subway advertisements, billboards). This in-depth blog explains Wayfair’s process.
In a nutshell, Wayfair randomly selects a subset of geographies within their target markets, and then they assign weights to the revenue per visitor (RPV) in each subset of geographies so that the subset geographies’ RPV mimics the behavior of the entire audience. Once Wayfair confirms that these weights hold up over time, they can attribute any changes in behavior among the subset audience to the advertising in those geographies.
(Mike Duboe, an investor at Greylock Partners, writes a decent explanation of other ways to test TV ads.)
Quasi Experiments
Netflix is ahead of the curve in their testing and experimentation. They provide a window into their approach in this blog that introduces their concept of “quasi experiments.”
These quasi experiments are tests that help Netflix understand if their marketing efforts are synergistic or cannibalistic, but these are not true holdout tests because Netflix never can be certain that the control group is completely isolated from the treatment. For example, when Netflix introduces a new product feature, it’s impossible for them to prevent people in the control group from learning about the new feature via word of mouth, mass media, etc.
So to help Netflix understand the interaction, for instance, between promoting a title in-product and also doing so via billboards, they introduce out-of-home ads in specific cities and then measure the effect. Per Netflix, “The results of a quasi-experiment won’t be as precise as an A/B, but we aspire towards a directional read on causality.”

Markov Chains
If the common purchase path for your customers includes three or more channels (paid or otherwise), you may wonder which channel is the most influential. The answer can inform your budget allocation and provide other helpful insights re: ROI and more.
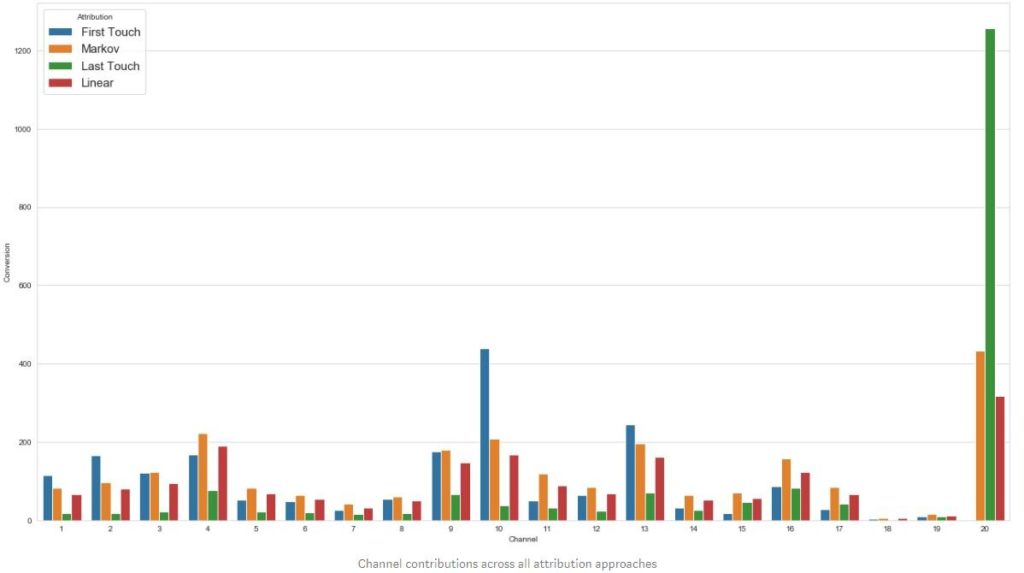
Basic attribution models (i.e. first-touch, last-touch, linear, etc.) oversimplify this conundrum. What Markov Chains enable is a framework to chart user journeys and understand how each channel influences the user’s likelihood of proceeding to another channel and, ultimately, purchasing (or not).
When you understand the probability of users moving from one channel to another, you can understand the relative value of each channel along the purchase path.
This post explains how to build four different attribution models, including Markov Chains, in Python. Here’s a description of how to build a channel attribution Markov model in R.
